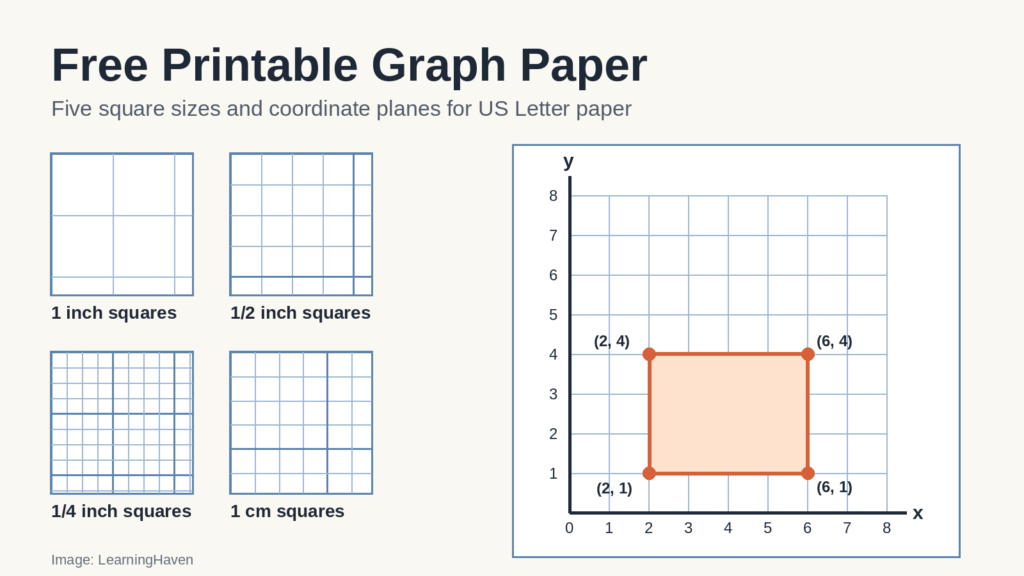
Graph paper is paper printed with a grid of equal squares that helps kids line up numbers, plot points, and draw shapes. This page has free printable graph paper in five square sizes plus three coordinate-plane sheets, and it shows how kids use each one in math.
What free printable graph paper can you download?
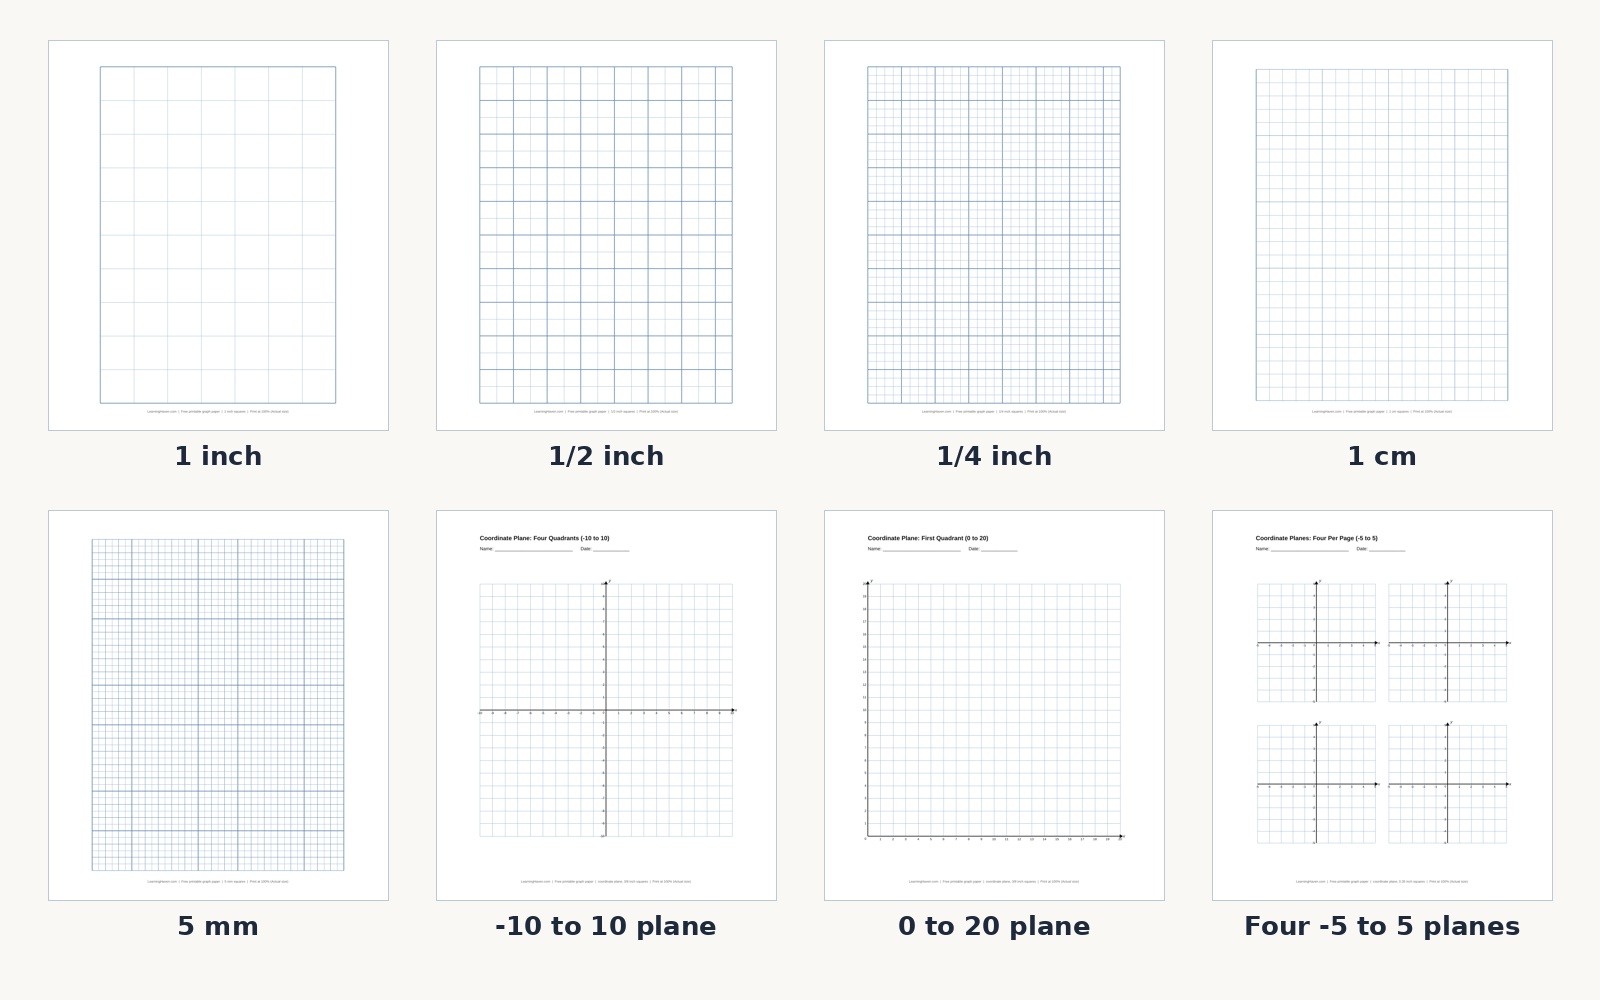
You can download five square-grid sheets and three coordinate-plane sheets, each a one-page PDF for US Letter paper. Wikipedia lists grid paper, coordinate paper, and squared paper as other names for graph paper. LearningHaven made every sheet below, and you can print as many copies as your family or classroom needs.
| Sheet | Squares across × down | Grid size on the page | Darker lines | Download |
|---|---|---|---|---|
| 1 inch large squares | 7 × 10 | 7 × 10 inches | none | Download the 1 inch graph paper (PDF) |
| 1/2 inch squares | 15 × 20 | 7.5 × 10 inches | every 2 squares (1 inch) | Download the 1/2 inch graph paper (PDF) |
| 1/4 inch squares | 30 × 40 | 7.5 × 10 inches | every 4 squares (1 inch) | Download the 1/4 inch graph paper (PDF) |
| 1 cm squares | 19 × 25 | 19 × 25 centimeters | every 5 squares (5 cm) | Download the 1 cm graph paper (PDF) |
| 5 mm squares | 38 × 50 | 19 × 25 centimeters | every 2 squares (1 cm) | Download the 5 mm graph paper (PDF) |
The three coordinate-plane sheets have numbered axes and a name and date line.
- Download the four-quadrant coordinate plane, -10 to 10 (PDF). It has 20 × 20 squares, each 3/8 inch.
- Download the first-quadrant coordinate plane, 0 to 20 (PDF). It has 20 × 20 squares, each 3/8 inch. The Common Core Grade 5 standard CCSS.Math.Content.5.G.A.2 asks students to graph “points in the first quadrant of the coordinate plane,” and this sheet is built for that.
- Download four coordinate planes on one page, -5 to 5 (PDF). Each plane has 10 × 10 squares, each 0.35 inch.
Which size should you pick? These are suggestions, not rules.
- 1 inch squares: big boxes for a child who is learning to write numbers in a grid or plot a first point.
- 1/2 inch squares: room for neat digits in column math.
- 1/4 inch squares: a finer grid for longer problems and shapes with many sides.
- 1 cm and 5 mm squares: metric sheets. Each 1 cm square is 1 centimeter on a side, and each 5 mm square is half a centimeter.
The darker lines mark bigger blocks. On the 1/4 inch sheet, a darker line falls every 4 squares, so each block is 1 inch (4 × 1/4 = 1). On the 1 cm sheet, a darker line falls every 5 squares, so each block is 5 centimeters.
This section covers the files on this page. It doesn’t cover A4 paper, dot grid, isometric grid, or polar graph paper, which these files don’t include.
How do you print graph paper at the right size?
Print at 100 percent, often labeled Actual size, because Fit to page can shrink the grid and change the square size. Printer menus use different words, so look for a scale or size setting. Then check one row of squares with a ruler.
Worked example. Check a 1/4 inch sheet.
- Print page 1 at 100 percent.
- Lay a ruler along one row of squares, starting at a line.
- Count 12 squares along the row.
- Work out the length: 12 × 1/4 inch = 3 inches.
- The ruler should read 3 inches at the 12th line. If it reads less, the printer shrank the page, so print again with scaling off.
Use the same check on every sheet.
| Sheet | Count this many squares | The ruler should read |
|---|---|---|
| 1 inch squares | 3 | 3 inches |
| 1/2 inch squares | 6 | 3 inches |
| 1/4 inch squares | 12 | 3 inches |
| 1 cm squares | 5 | 5 centimeters |
| 5 mm squares | 10 | 5 centimeters |
| Coordinate planes with 3/8 inch squares | 8 | 3 inches |
| Four-per-page coordinate planes | 10 | 3.5 inches |
This section covers checking square size on a home print. It doesn’t cover the exact menu steps for each printer brand, which differ.
What is graph paper used for in math?
Kids use graph paper to plot points, find area, draw bar graphs, and keep digits in straight columns. Two Common Core standards describe work that graph paper supports. The Common Core State Standards Initiative’s Grade 5 standard CCSS.Math.Content.5.G.A.2 says to “Represent real world and mathematical problems by graphing points in the first quadrant of the coordinate plane, and interpret coordinate values of points in the context of the situation.” Its Grade 3 standard CCSS.Math.Content.3.MD.B.3 says to “Draw a scaled picture graph and a scaled bar graph to represent a data set with several categories.”
Here are the four uses, with a section on each below.
- Plotting points on a coordinate plane.
- Finding area and perimeter by counting squares and edges.
- Lining up digits in addition, subtraction, and other column math.
- Making bar graphs with one square standing for a set number of things.
This section covers the four uses taught on this page. It doesn’t cover state standards, which can differ from Common Core, or graph paper for art and engineering.
How do you plot points on graph paper?
Start at the origin, move across by the first number, then move up by the second number, and mark the point. The two numbers in (x, y) are an ordered pair. The origin is the point (0, 0) where the two axes, the number lines, cross. The Common Core standard CCSS.Math.Content.5.G.A.1 says “the first number indicates how far to travel from the origin in the direction of one axis, and the second number indicates how far to travel in the direction of the second axis.” The same standard pairs the x-axis with the x-coordinate and the y-axis with the y-coordinate.
Use the first-quadrant sheet when every number is zero or positive. Use the four-quadrant sheet when a point has a negative number. Our coordinate geometry page explains the four quadrants in full.
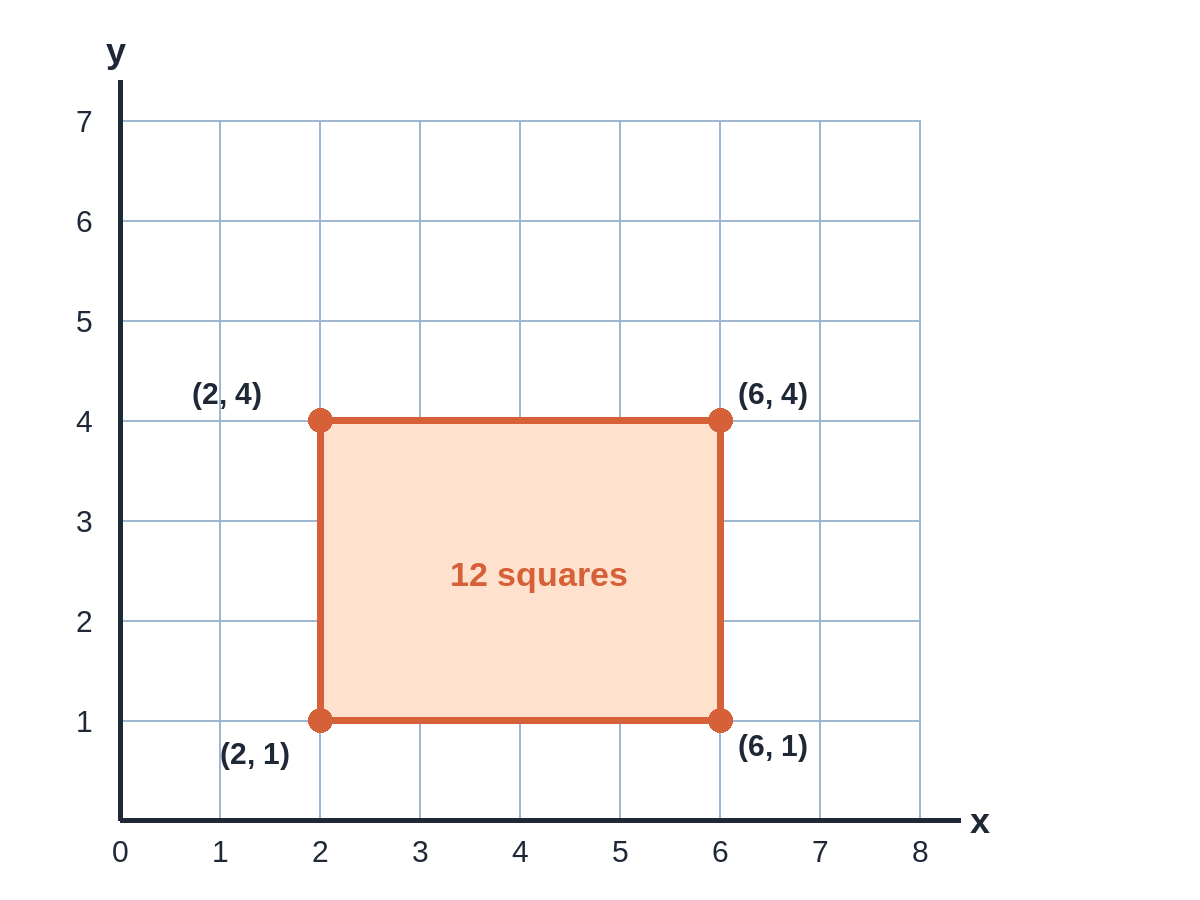
Worked example. Plot the rectangle with corners (2, 1), (6, 1), (6, 4), and (2, 4).
- Plot (2, 1). From the origin, move 2 right, then 1 up. Mark a dot.
- Plot (6, 1). Move 6 right, then 1 up.
- Plot (6, 4). Move 6 right, then 4 up.
- Plot (2, 4). Move 2 right, then 4 up.
- Join the dots in order and close the shape.
The bottom side runs from x = 2 to x = 6, so it is 6 − 2 = 4 squares long. The left side runs from y = 1 to y = 4, so it is 4 − 1 = 3 squares tall. The shape is a rectangle that is 4 squares wide and 3 squares tall.
So far you have chosen a sheet, printed it at 100 percent, and plotted a rectangle on it. This page offers five square-grid sheets and three coordinate-plane sheets, and it teaches four uses: plotting points, finding area and perimeter, lining up digits, and making bar graphs. Every example below counts squares, so the size of the sheet decides what one square means.
This section covers plotting points in the first quadrant. It doesn’t cover graphing lines or equations, which build on this idea in algebra.
How do you find area and perimeter on graph paper?
Count the squares inside a shape for area, and count the square edges around the outside for perimeter. Area is the amount of flat space inside a shape, counted in square units. Perimeter is the distance around the outside of a shape. The Common Core Grade 3 standard CCSS.Math.Content.3.MD.C.7.a asks students to “Find the area of a rectangle with whole-number side lengths by tiling it, and show that the area is the same as would be found by multiplying the side lengths.”
Worked example. Find the area and perimeter of the rectangle from the last section.
- Count the squares inside. There are 4 columns and 3 rows, so 4 × 3 = 12 squares.
- Multiply the side lengths to check: 4 × 3 = 12. The count and the product match.
- Add the four sides for the perimeter: 4 + 3 + 4 + 3 = 14 edges.
The area is 12 square units and the perimeter is 14 units.
Worked example. Find the area and perimeter of an L-shape with corners (0, 0), (6, 0), (6, 2), (2, 2), (2, 5), and (0, 5).
- Split the shape into two rectangles. The bottom one is 6 wide and 2 tall. The top one is 2 wide and 3 tall.
- Find each area: 6 × 2 = 12 and 2 × 3 = 6.
- Add the parts: 12 + 6 = 18 squares.
- Add the six sides for the perimeter: 6 + 2 + 4 + 3 + 2 + 5 = 22 edges.
The area is 18 square units and the perimeter is 22 units.
What one square means depends on the sheet. On the 1 cm sheet, 18 squares is 18 square centimeters. On the 1/2 inch sheet, one square covers 1/2 × 1/2 = 1/4 square inch, so 18 squares cover 18 × 1/4 = 4.5 square inches.
This section covers rectangles and L-shapes with whole-number sides. It doesn’t cover triangles or curved shapes, which are on our area formulas and perimeter formulas pages.
How do you line up multi-digit math on graph paper?
Write one digit in each square so ones, tens, and hundreds stay in their own columns. The 1/2 inch sheet gives each digit plenty of room. Keeping columns straight stops the most common slip in column math, which is adding or subtracting digits from different place values.
Worked example. Add 347 and 285, one digit per square.
    3 4 7
  + 2 8 5
  -------
    6 3 2
- Ones column: 7 + 5 = 12. Write 2 and carry 1 ten.
- Tens column: 4 + 8 + 1 = 13. Write 3 and carry 1 hundred.
- Hundreds column: 3 + 2 + 1 = 6.
Reading the columns gives 632. So 347 + 285 = 632. Check: 632 − 285 = 347.
Subtraction and long division use the same square-per-digit habit. Our subtraction page covers regrouping and our division page covers long division. The addition page and the multiplication page cover the other two operations.
This section covers lining up digits. It doesn’t cover the rules for regrouping, which the linked pages teach step by step.
How do you make a bar graph on graph paper?
Choose a scale like 1 square for 5 pets, then divide each count by 5 to find how many squares tall to draw each bar. A scale tells you how many things one square stands for. The Common Core Grade 3 standard CCSS.Math.Content.3.MD.B.3 gives this example of a bar graph where “each square in the bar graph might represent 5 pets.”
Worked example. A class survey counts pets. The numbers below are made-up practice data. Use a scale of 1 square for 5 pets.
| Pet | Count | Squares tall (count ÷ 5) |
|---|---|---|
| Dogs | 15 | 3 |
| Cats | 10 | 2 |
| Fish | 5 | 1 |
| Hamsters | 20 | 4 |
- Draw a bottom line and a left line on the sheet. Label the left line with a count for every square, such as 5, 10, 15, 20.
- Draw the dogs bar 3 squares tall, the cats bar 2 squares tall, the fish bar 1 square tall, and the hamsters bar 4 squares tall.
- Label each bar with its pet.
Now you can compare bars. The hamsters bar is 4 − 1 = 3 squares taller than the fish bar. Since 1 square is 5 pets, that is 3 × 5 = 15 more hamsters than fish. Check: 20 − 5 = 15.
This section covers single bar graphs with whole-number scales. It doesn’t cover line graphs or histograms.
Practice set
Work through these on paper, then check your answers. Use the sheet that fits each problem.
- Plot (5, 2), (5, 6), (9, 6), and (9, 2). Name the shape and find its area.
- Name the quadrant for each point: (−4, 3), (2, −5), and (−1, −1).
- A line on the 1/4 inch sheet covers 14 squares. How many inches long is it?
- A rectangle on the 1 cm sheet is 9 squares wide and 4 squares tall. Find its area and perimeter.
- On a bar graph, each square stands for 5 books. One bar is 7 squares tall and another is 4 squares tall. How many more books does the taller bar show?
- Add 468 and 359 with one digit in each square.
Show answers and reasoning
- The shape is a square with an area of 16 square units. The bottom side runs from x = 5 to x = 9, so it is 9 − 5 = 4 long. The left side runs from y = 2 to y = 6, so it is 6 − 2 = 4 tall. Area: 4 × 4 = 16. Check: count 4 columns of 4 squares, and 4 + 4 + 4 + 4 = 16.
- (−4, 3) is in Quadrant II, (2, −5) is in Quadrant IV, and (−1, −1) is in Quadrant III. In II the x value is negative and the y value is positive. In IV the x value is positive and the y value is negative. In III both are negative. Check: none has two positive numbers, so none is in Quadrant I.
- The line is 3 1/2 inches long, which is 3.5 inches. Each square is 1/4 inch, so 14 × 1/4 = 14/4 = 3.5. Check: 14 squares is 12 squares plus 2 squares, which is 3 inches plus 1/2 inch.
- The area is 36 square centimeters and the perimeter is 26 centimeters. Area: 9 × 4 = 36. Perimeter: 9 + 4 + 9 + 4 = 26. Check: 2 × (9 + 4) = 2 × 13 = 26.
- The taller bar shows 15 more books. The tall bar is 7 × 5 = 35 books and the short bar is 4 × 5 = 20 books. Then 35 − 20 = 15. Check: the bars differ by 3 squares, and 3 × 5 = 15.
- 468 + 359 = 827. Ones: 8 + 9 = 17, write 7 and carry 1. Tens: 6 + 5 + 1 = 12, write 2 and carry 1. Hundreds: 4 + 3 + 1 = 8. Check: 827 − 359 = 468.
Graph paper turns math you already know into pictures you can count. To go further with plotting, try our coordinate geometry page, and for shapes see area formulas and perimeter formulas. For more printables, visit math worksheets and homeschool worksheets. For more topics, visit our math hub.
Sources
- Common Core State Standards Initiative. Grade 5, Geometry.
- Common Core State Standards Initiative. Grade 3, Measurement and Data.
- Wikipedia. Graph paper.