A coordinate is a number that gives the position of a point. Coordinate geometry uses pairs of numbers to locate points on a grid, so every point has one exact address.
The pair is written in brackets and separated by a comma, like (3, 4). This page covers what those numbers mean, how to read them, and how to plot them.
Starting with a lettered grid
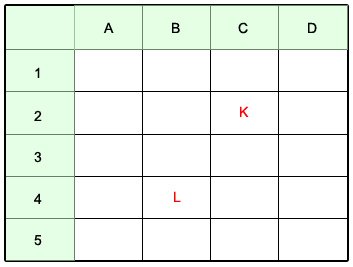
A street map uses the same idea. Columns get letters, rows get numbers, and any square is named by the pair.
Point K sits in column C, row 2, so its position is C2. Point L sits in column B, row 4, so its position is B4.
Coordinate geometry replaces the letters with numbers and the squares with exact points. Everything else works the same way.
The coordinate plane
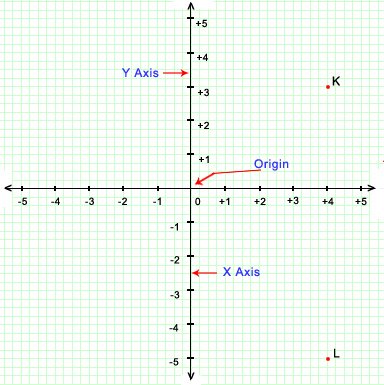
Two number lines crossing at right angles make a coordinate plane. Each part has a name.
| Part | What it is |
|---|---|
| x axis | The horizontal number line |
| y axis | The vertical number line |
| Origin | The point where the two axes cross, written (0, 0) |
| Quadrant | One of the four regions the axes divide the plane into |
Numbers to the right of the origin are positive and numbers to the left are negative. Numbers above the origin are positive and numbers below are negative.
In the figure, K is 4 to the right and 3 up, so K is (4, 3). L is 4 to the right and 5 down, so L is (4, −5).
Reading a pair of coordinates
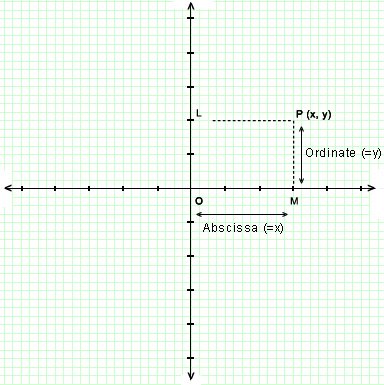
A point P is written P(x, y). The two numbers have their own names.
- The abscissa is the x value, measured along the x axis.
- The ordinate is the y value, measured along the y axis.
The x value always comes first. This is the rule that catches people out, because (3, 4) and (4, 3) are two different points.
A useful memory hook: you walk along the hall before you climb the stairs. Across first, then up.
The four quadrants
The axes cut the plane into four quadrants, numbered counterclockwise starting from the top right.
| Quadrant | Position | Signs |
|---|---|---|
| I | Top right | x positive, y positive |
| II | Top left | x negative, y positive |
| III | Bottom left | x negative, y negative |
| IV | Bottom right | x positive, y negative |
A point sitting on an axis is in no quadrant at all. (0, 5) is on the y axis and (−3, 0) is on the x axis.
Plotting and reading points
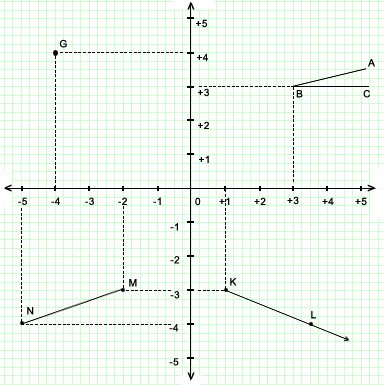
To plot a point, start at the origin, move along the x axis by the first number, then move parallel to the y axis by the second number.
Reading the figure gives these points:
- G is 4 left and 4 up, so G is (−4, 4). Quadrant II.
- B is 3 right and 3 up, so B is (3, 3). Quadrant I.
- M is 2 left and 3 down, so M is (−2, −3). Quadrant III.
- K is 1 right and 3 down, so K is (1, −3). Quadrant IV.
- N is 5 left and 4 down, so N is (−5, −4). Quadrant III.
The dashed lines in the figure show the method. Drop a line from the point to each axis, then read off where it lands.
Where the idea came from
Coordinate geometry is also called Cartesian geometry, after the French mathematician René Descartes (1596 to 1650). Pierre de Fermat worked out the same idea independently at around the same time, though Descartes published first and the name stuck.
The significance is that it joins two subjects. Once a point is a pair of numbers, a shape becomes an equation and geometry can be done with algebra.
What this page does not cover
This page covers locating and plotting points. Distance between two points, midpoints, slope, and the equations of lines build on these ideas and are covered separately. Three-dimensional coordinates, which add a z value, are not used here.
Where to go next
For the shapes you will plot on a grid, see polygon basics. For the algebra side of the subject, see algebra. The section index is in geometry.